In this article you can find information about what you should consider when performing wireless measurements and how you can configure mixed sample rates.
1 Introduction
The Whitepaper “Measuring electrophysiological signals with SAGA” provided an introduction to considerations in the data path of physiological signal acquisition. Figure 1 shows this data path in terms of different bandwidths that need to be considered. The first bandwidth is the signal bandwidth, the second bandwidth is the bandwidth of the acquisition system and the third bandwidth is the communication bandwidth. This article is focused on the final bandwidth type: the communication bandwidth or data rate. The communication bandwidth introduces restrictions to the measurement setup in wireless measurements. As a remedy, the option to configure mixed sample rates is implemented on SAGA. To interpret the acquired data correctly, post-processing the data is required.
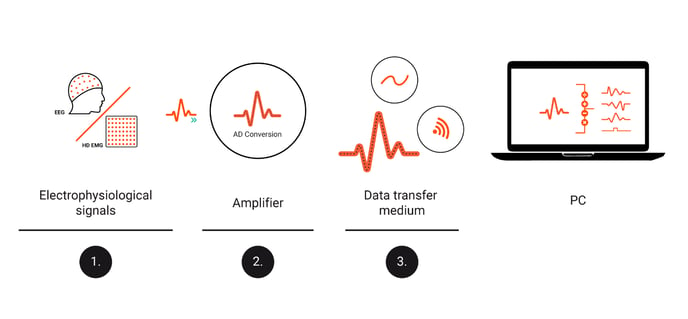
Figure 1: Bandwidths that need to be considered in signal acquisition. 1) Signal bandwidth, 2) Bandwidth of the acquisition system and 3) Communication bandwidth.
2 Mixed sample rate measurements
When sampling signals, the Data Recorder produces signal data that must be stored and/or transferred to the PC for processing. The signal data is first transferred to the Docking Station and from there to the PC. There is a limit to the amount of data that can be transferred between Data Recorder and Docking Station per unit of time. The same is true for the data transfer between Docking Station and PC. This limit is called the communication bandwidth and it is expressed in bits per second. The communication bandwidth between Docking Station and PC, and also for the docked or the optical fiber connections, is always larger than the amount of data that the Data Recorder can produce per unit of time. The communication bandwidth of the wireless communication between Data Recorder and Docking Station is lower, as this is only 2 Mbit/s under ideal circumstances. The same holds for card recordings, as the communication bandwidth for these recordings is limited to 2 Mbit/s as well. The communication bandwidth is too low when sampling 64 channels at a sample rate of 4000 Hz, which results in a data rate of approximately 6 Mbit/s. This means that in some configurations, not all data sampled by the Data Recorder can be transferred to the Docking Station in time. In these cases, it is necessary to select a different configuration that causes less data to be sampled by the Data Recorder.
To facilitate this with SAGA, it is possible to choose a sample rate per channel type or to switch off channels that are not used. SAGA supports multiple signal input types: Auxiliary (AUX), Bipolar (BIP) or Unipolar (UNI). Various sample rates are supported, which are applied to all channels of a given type. From a base sample rate of 4096 Hz, other rates can be chosen that are (successive) divisions by 2. Thus 2048 Hz, 1024 Hz and 512 Hz can be chosen. The alternative base rate for SAGA is 4000 Hz, and lower rates for successive divisions by 2 from that base rate are 2000 Hz, 1000 Hz and 500 Hz. This means that when a base sample rate of 4000 Hz is chosen, the measurement setup can have active BIP channels that are sampled at 4000 Hz, whilst the AUX channels might be sampled at 500 Hz.
The data transfer between Data Recorder and Docking Station is determined by the Data Recorder, which will take the simplest approach for the transfer of data. All signals for all channels are assembled in a packet at the rate of the slowest chosen sample rate. For every signal, the available samples are inserted in that packet. This means that if, for example, sample rates of 4000 Hz for BIP, 2000 Hz for UNI and 500 Hz for AUX are chosen, one packet is assembled each 2 ms (= 1/500 Hz, for the slowest sample rate) and the packet is filled with samples of each channel’s data in the following manner:
- 8 samples for BIP channel data
- The signal is sampled at 4000 Hz, so 8 unique sample values are available.
- 4 samples for UNI channel data
- The signal is sampled at 2000 Hz, so only 4 unique sample values are available.
- 1 sample for AUX data
- The signal is sampled at 500 Hz, so only a single unique sample is available.
For simple representation of the acquired signals (such as plotting on a screen) it is convenient to have all signals on a single time base. To facilitate that, the Docking Station will supplement the data to ensure that a sample value is available for every signal at the highest chosen sample rate. Following the example, it expands every sample packet to 8 sample values for each individual channel in the following fashion:
- The same 8 samples for BIP channel data.
- Each of the 4 samples of every UNI channel data is duplicated, to arrive at 8 samples.
- Every single sample of AUX data is repeated 7 more times, giving 8 (identical) samples in the packet.
3 Post-processing mixed sample rate measurements
As described in the previous section, the obtained data from the Docking Station contains duplicates for the channels measured at lower sample rates. Hence, the resulting data can simply be plotted to the screen. However, when using the data in the subsequent analysis, it is important to be aware of the actual sample rate at which the signals have been retrieved to prevent mistakes in interpretation. The risk of leaving the duplicates in the retrieved data depends on the application. For example, duplicate values of slowly changing signals may have a negligible effect on the interpretation. However, for any situation it is best to carefully evaluate the effect of duplicate values, and perform post-processing if necessary, so that the risk of incorrect interpretation of the (electro-)physiological is mitigated.
4 Strategies to prevent incorrect interpretation of signal data
Different approaches can be taken to deal with the acquired signals in the application software. The chosen approach strongly depends on the type and amount of further signal processing that can be done. In all cases it is important to know the (original) sample rate of the signal. Three possible approaches are listed:
- Reduce the sample rate to its original value.
Create a new data set and a new time base, both with the original sample rate, and obtain only the samples corresponding to this sample rate. This results in exactly the same data that the Data Recorder produced. In terms of signal integrity and simplicity this is the best solution. However, any further signal processing or analysis strategy needs to be able to deal with two (or more) time bases appropriately.
- Modify the duplicated samples to interpolated data.
This method requires more processing but maintains the (higher) sample rate. Different interpolation strategies may be applied, which may vary in complexity. For instance, linear interpolation may be applied which uses two consecutive, original data points. Another option is to use spline interpolation, which makes use of a multitude of data points to retrieve the interpolated values. Whether or not the integrity of the signal remains sufficient, depends on the specifications set out by the researcher.
- Modify the sample copies to NaN values.
A NaN is “Not a Number”, a special code in the floating-point range for computers that indicates it is not an actual numerical value. This removes the duplicate values in the time series, keeping the time base as is. Recognition of copied samples is easy: Taking into account the origin of the sampled data and the resolution of the data it is virtually impossible to have two successive samples that are exactly equal (unless it is 0 or out of range). Hence, when consecutive samples are exactly equal, samples can be converted to NaN’s. However, NaN’s are not always supported by all file formats and might result in unusable datasets.
5 Summary
Due to the limited communication bandwidth of the wireless link between SAGA’s Data Recorder and Docking Station, design choices were made to make optimal use of the available bandwidth. Therefore, when mixed sample rates are configured for a measurement, duplicates are inserted by SAGA’s Docking Station so that a single time base is obtained for all samples. This article outlined this behavior, as well as describing different strategies that may be employed to ensure that the acquired data is post-processed correctly, to mitigate the risk of incorrect interpretation of acquired data.