TMSi provides an example Python script to analyze the data obtained during an ERP experiment.
Introduction
The P300 is a specific type of Event-Related Potential (ERP) that is linked to neural processes like attention allocation, working memory, and decision-making. For more detailed information about ERPs and the P300, please check our blog. TMSi provides a hardware and software solution for measuring P300. To show how to run a P300 experiment, a sample dataset and a measurement protocol are provided. The measurement protocol is described in this blog. This article explains how the sample dataset (obtained by following the experimental protocol) can be analyzed using TMSi's example script in the TMSi Python interface.
To run the example script, follow the following steps:
- Make sure Python version 3.8.10 installed. If this version of python is not installed yet, you can download it on the official Python page.
- Download the latest TMSi Python interface release.
- Two installers are included in the TMSi Python interface. Please run the 'installer39_Windows'and the 'installer PsychoPy'. Wait for the installations to finish.
- Download the dataset 'sample_data_erp_experiment.poly5' on TMSi's Gitlab page. Place this .Poly5 file in the tmsi-python-interface-main\measurements folder of the TMSi Python Interface.
- Open the 'example_erp_analysis.py' in Spyder. You can find thie example script in this folder: tmsi-python-interface-main/TMSiPlugins/PsychoPy/example_erp_analysis.py
- Lastly, when using Spyder, it’s needed to change the Python interpreter to the virtual environment’s Python installation. The custom environment can be configured in Preferences (🔧)→ Python interpreter. The specific file to select can be found in this path: "....\tmsi-python-interface-main\.venv_psychopy\Scripts\python.exe"
The next section of this article explains how to analyse the P300 data set. Start by running the 'example_erp_analysis.py' script. You will receive a pop-up asking if you'd like to see the full version of the script. To follow this article, click 'no'.
The script contains the following steps:
Loading the data:
When running the script, the first prompt for the user is to load the sample data 'sample_data_erp_experiment.poly5'. After the file is imported, the EEG data is re-referenced and a band-pass filter is applied. For more detailed information about those steps, please refer to this blog.
Applying Independent Component Analysis (ICA):
Next, ICA is used to remove eye blinks and eye movements which are major sources of physiological artifacts in EEG data. You can read more about ICA in this blog. Figure 1 shows the resulting Independent Components following the ICA procedure. A similar figure will be plotted in the script. It is essential to select the components containing ocular artifacts for removal. In this example, components ICA001 (eye blink artifacts) and ICA003 (horizontal eye movement artifacts) can be selected for removal.
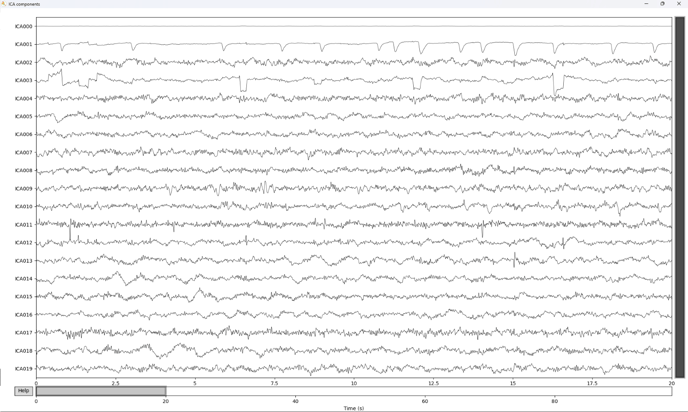 Figure 1: ICA components
Epoch analysis:
It's common practice to analyze a certain time window (epoch) around the moment that the stimulus was presented. In this example, EEG data for an epoch of -200 ms to 800 ms (0 ms being the stimuli presentation moment) is taken. The EEG data is averaged over all trials for the target and non-target responses per channel.
Showing the P300 response:
After selecting the ICA compenents that can be removed, the three example results are plotted. First, the averaged EEG signal is plotted per channel. Some channels will show a bigger response than other channels.
Next, the average of EEG signals of all trials from 9 selected channels (P3, Pz, P4, C3, Cz, C4, F3, Fz, and F4) is plotted for the target and non-target stimulus. This shows the P300 response as shown in Figure 2 of this article. The P300 is defined as the maximal amplitude of the signal (compared to the baseline) between 250 ms and 500 ms.
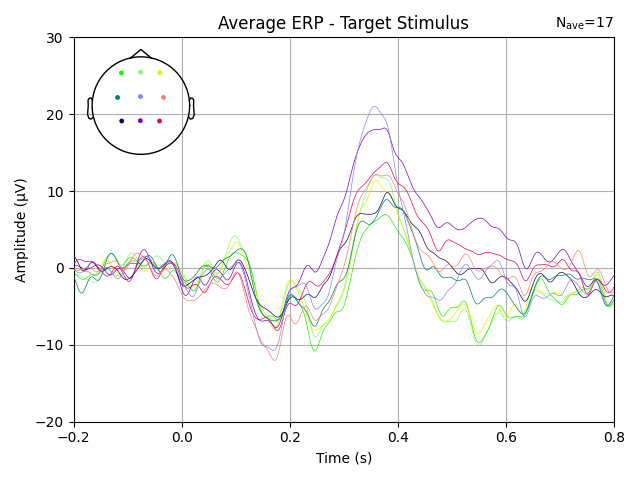 Figure 2: main result of analysis script - P300 response to the target stimulus
Based on this data, multiple features of the P300 response can be extracted. The last figure shows the data the mean and standard deviation of the latency and amplitude of the P300.
Interested in more?
To learn more about the P300, check out our blog on the subject. If you're interested in adapting this analysis script yourself, the documentation in the TMSi Python interface provides a step-by-step explanation of the code and how to adapt it.
Are you interested in performing ERP research? Contact info@tmsi.com or check out our website to learn more about how we can help you.
Do you have further questions on this topic?
Contact ✉️ support@tmsi.com, 📞+31 (0)541 539 013 or 📄 request support.